
Climate Summary of Donner Summit, California 1870-2001
Randall Osterhuber
Univ. of California, Central Sierra Snow Laboratory
Introduction
 The following is a summary of air temperature, precipitation, and snowpack data from the Donner Summit region of the Sierra Nevada, California. The precipitation data originates from four different sites, all within 5 km (3.1 miles) and 82 m (269 feet) elevation of each other. The air temperature data is from a single location. Data collection sites are listed at the end of this paper.
The demand for high-quality water is prevalent throughout the western United States. As population continues to increase so too does pressure to wisely manage snowmelt runoff from mountain ranges. Industry, recreation, fisheries, electricity production, agriculture, and riparian health all have claims-and sometimes competing interests—levied against the West's most valuable resource: water.
The melting of spring and early summer snowfields supplies substantial amounts of water to the western United States. Understanding the seasonal, spatial, and physical variations of snowpacks and alpine watershed climatic regimes is essential if water managers are to have sufficient resiliency to cope with climatic change.
Long-term weather records from western United States snow-zones are rare. This summary reports on 131 years of precipitation data, 123 years of snowfall data, and 49 years of air temperature data.
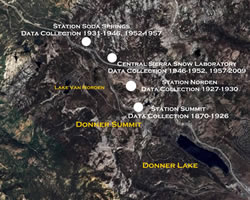
Donner Summit
The Donner Summit region (39°19'N, 120022'W) of the Sierra Nevada bridges the Sierra crest 25 km (15.5 miles) northwest of lake Tahoe. The terrain is mostly granitic bedrock steps overlaid with volcanic rocks of more recent epochs. Timberline is about 2500 m (8200 feet) with lodgepole pine (Pinus murrayana), red fir (Abies magnifica), and whitebark pine (Pinus albicaulis) the dominant conifers. A maritime climate persists with Pacific storm tracks throughout the winter but relatively little precipitation during summer months. Mt. Lincoln (2555 m, 8383 feet), 3 km (1.9 miles) south of Donner Pass, forms a triple watershed divide, partitioning its runoff between the Yuba, American, and Truckee Rivers.
Tables and Figures
The following tables and figures outline the climatic history of the area and are described below.
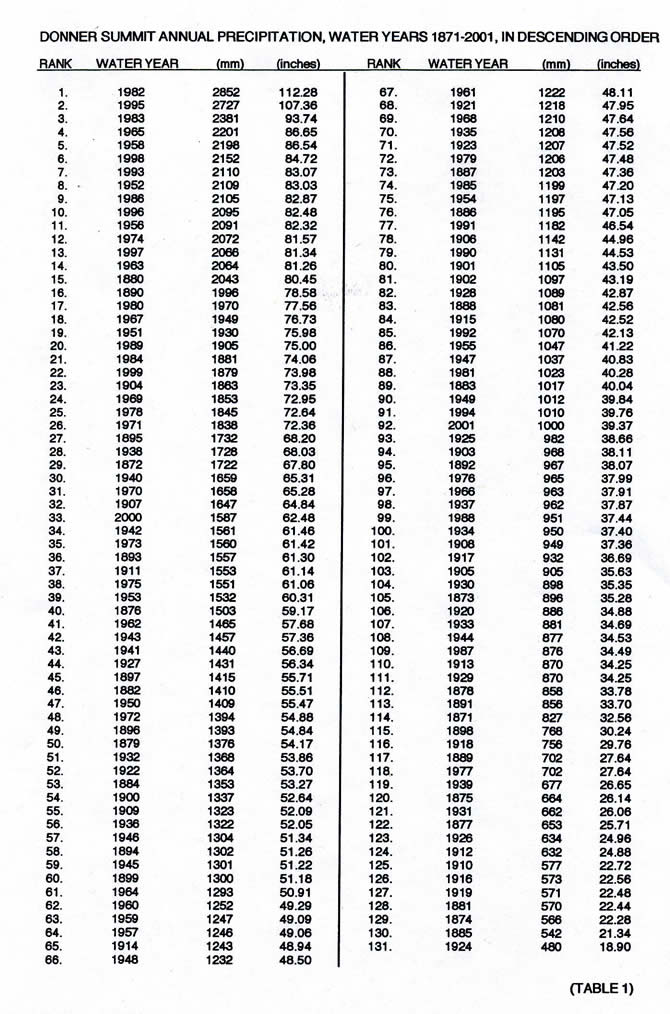
TABLE 1 is the total seasonal precipitation (October 1 -September 30) of each water year ranked from wettest (1982) to driest (1924). The 131-year mean is 1311 mm (51.61 inches); the median 1243 mm (48.9' inches). The standard deviation of the data set equals 489 mm (19.25 inches).
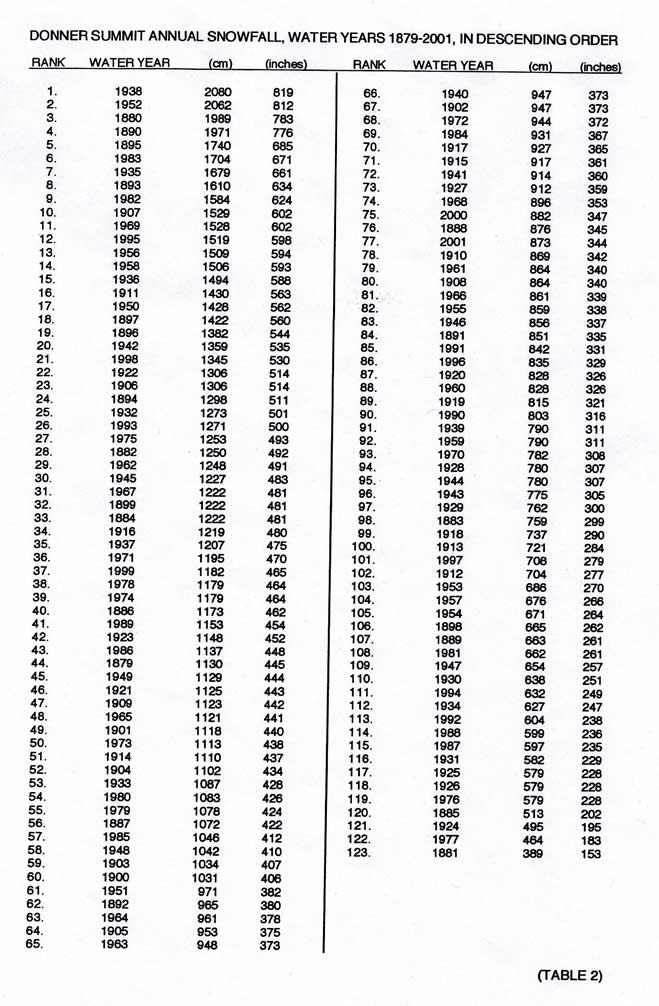
TABLE 2 is a similar listing of the last 123 years of snowfall. The 123-year mean is 1038 cm (409 inches); the median 965 cm (380 inches). The standard deviation of the data set equals 348 cm (137 inches). A precipitation measurement is the water equivalent depth of the precipitate, whether it falls as rain, snow, or a mix of the two. It is an objective measure of water accumulation over some period of time. Snowfall measurements, however, are not necessarily as objective. As new snow accumulates, its weight compresses previously accumulated layers. Measured values of new snow depth are therefore a function of measurement frequency. Higher values will result from more frequent measurements. The total seasonal snowfall presented in this table—and the values from Figures 2, 6, and 10—should be considered an index only. Starting October 1965, the snowfall measurement frequency has been twice a day: at 0800 and 1600 local time. Snowfall measurement frequency prior to water year 1966 is not known for certain, but assumed to be at least once a day whenever snowfall occurred.
FIGURE 1 is a bar chart plotting the historic precipitation record.
FIGURE 2 is a bar chart plotting the historic snowfall record.
FIGURE 3 is a plot of the 49-year (1947-1952, 1959-2001) average snow depth throughout the winter season. The curve has been smoothed to fit the data and the months (as depicted on the plot) have been standardized to a length of 30.4 days. Peak snow depth is typically reached in the middle of March.
FIGURE 4 is a plot of the 49-year (1947-1952, 1959-2001) average snowpack snow water equivalent throughout the winter season. The curve has been smoothed to fit the data and the months (as depicted on the plot) have been standardized to a length of 30.4 days. Peak snowpack snow water equivalent is typically reached the fourth week of March. Dividing the snowpack snow water equivalent of any day by that date's corresponding snow depth yields an average snowpack density.
FIGURE 5 is a bar chart plotting the 20 greatest consecutive-day precipitation totals since 1946 excluding water years 1953 to 1956. The dates of each of the events are listed. The event of December 1964 exceeds any other by more than 35 percent.
FIGURE 6 is a bar chart plotting the 20 greatest consecutive-day snowfall totals since 1946 excluding water years 1953 to 1956. The dates of each of the events are listed. The largest snowstorm on record, that of March 27-April 8, 1982, led to the death of seven people in an avalanche 21 km ( 13.0 miles) south of Donner Summit.
FIGURE 7 is a plot of the 49-year (1947-1952, 1959-2001) average monthly maximum and minimum air temperatures. The curve has been smoothed to fit the data. Note that the average maximum air temperature is greater than 0°C (32°F) for every month of the year. The table at right compares the historic averages with those recorded during Water Year 2001. Particular attention should be directed to the monthly maximum temperatures of March, May, and August. The departure from average for May 2001 was greater than 8 degrees Celsius (14 degrees Fahrenheit).
FIGURE 8 is a plot of the 50-year (1947-1952, 1958-2001) average number of days per month with precipitation. Though March is not the wettest month of the year, it has on average more days with precipitation than any other. On average, precipitation can be expected on 106 days of the year, 29 percent of the calendar days.
FIGURE 9 is a plot of the 102-year (1900-2001) average monthly precipitation. Almost 80 percent of the annual precipitation falls between October and April.
FIGURE 10 is a plot of the 49-year (1947-1952, 1959-2001) average monthly snowfall totals.
FIGURE 11 is a scatter plot of the date of permanent (annual) snow cover for 50 years (1946-1951, 1957-2000). The average date is November 19 and has been as late as January 2 (1948) and as early as October 24 (1951). QuickTime slideshow of charts.
FIGURE 12 is a scatter plot of the first day in spring/summer with a 0 (zero) snow depth, for 50 years (1946, 1952, 1958-2001). May 23 is the average date. Melt-out has been as early as April 5 (1988) and as lat. June 30 (1967). November 19 through May 23 represents 185 days, on average, with mostly continuous SI cover. This is 51 percent of the calendar days. QuickTime slideshow of charts.
Data Sources and Sites
Though there is some overlap, the following dates are data collection periods from the various Donner Summit locations.
- 1870-1926, Station Summit
- 1927-1930, Station Norden
- 1931-1946, Station Soda Springs
- 1946-1952, Central Sierra Snow Laboratory
- 1952-1957, Station Soda Springs
- 1957-2001, Central Sierra Snow Laboratory